TABLE 15-9
Many factors determine the attendance at Major League Baseball games. These factors can include when the game is played, the weather, the opponent, whether or not the team is having a good season, and whether or not a marketing promotion is held. Data from 80 games of the Kansas City Royals for the following variables are collected.
ATTENDANCE = Paid attendance for the game
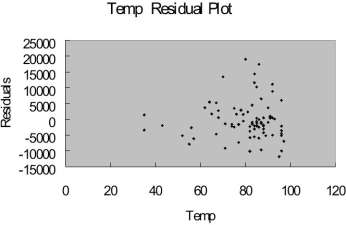
TEMP = High temperature for the day
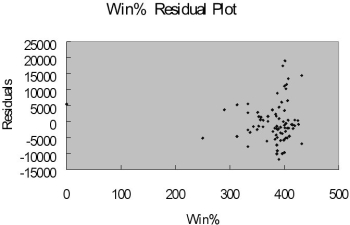
WIN% = Team's winning percentage at the time of the game
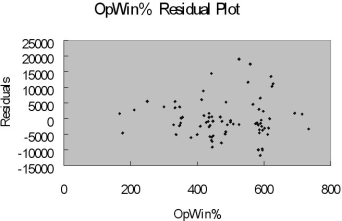
OPWIN% = Opponent team's winning percentage at the time of the game WEEKEND - 1 if game played on Friday, Saturday or Sunday; 0 otherwise PROMOTION - 1 = if a promotion was held; 0 = if no promotion was held
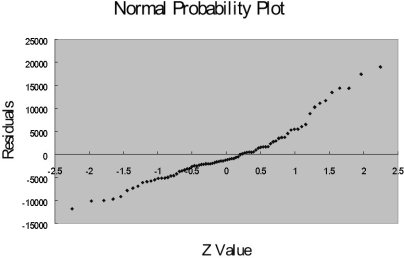
The regression results using attendance as the dependent variable and the remaining five variables as the independent variables are presented below.
The coefficient of multiple determination ( R 2 j ) of each of the 5 predictors with all the other remaining predictors are,
respectively, 0.2675, 0.3101, 0.1038, 0.7325, and 0.7308
-Referring to Table 15-9, which of the following assumptions is most likely violated based on the residual plot for TEMP?
Definitions:
Capital Structure
The mix of different forms of funds used by a company to finance its overall operations and growth, including debt, equity, and hybrid instruments.
Equity Financing
The process of raising capital through the sale of shares in a company to investors.
Du Pont Identity
A formula that breaks down Return on Equity (ROE) into three component parts: profit margin, asset turnover, and financial leverage, to analyze a company’s financial performance.
Profit Margin
A fiscal indicator calculating the proportion of income left once total costs are subtracted from revenues.
Q12: Using the Studentized residuals ti to
Q15: Referring to Table 17-3, which investment has
Q27: Referring to Table 13-8, the interpretation of
Q29: Referring to Table 15-7, suppose the chemist
Q50: Referring to Table 14-16, there is sufficient
Q56: Referring to Table 14-4, one individual in
Q69: Suppose the light bulbs in a factory
Q79: Given a data set with 15 yearly
Q101: A medical doctor is involved in a
Q251: Referring to Table 14-17, what should be