TABLE 13-12
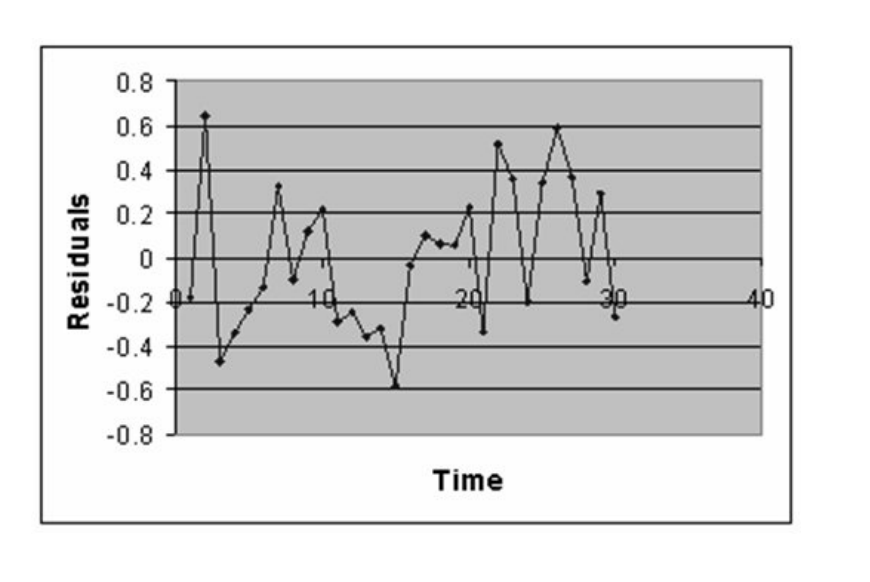
The manager of the purchasing department of a large banking organization would like to develop a model to predict the amount of time (measured in hours) it takes to process invoices. Data are collected from a sample of 30 days, and the number of invoices processed and completion time in hours is recorded. Below is the regression output:
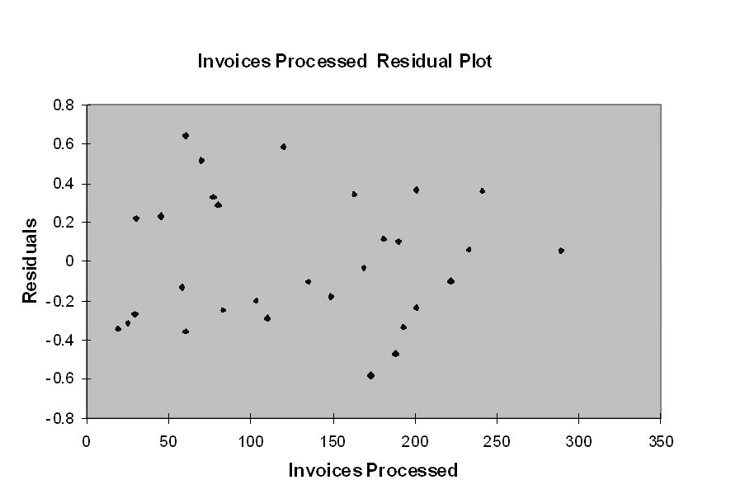
-Referring to Table 13-12, the estimated average amount of time it takes to process one additional invoice is
Definitions:
Types Of Inventory
Types Of Inventory categorize stock into various forms such as raw materials, work-in-progress, and finished goods, each serving different roles in production and sales processes.
Ordering Costs
Expenses incurred in placing and receiving orders from suppliers, including costs related to ordering processing, transport, and receiving.
Carrying Costs
Expenses associated with holding or storing inventory over a certain period, including warehousing, insurance, and spoilage costs.
Optimal Order Quantity
Refers to the number of units that should be ordered to minimize the total inventory costs like ordering, holding, and shortage costs.
Q21: Referring to Table 15-9, there is reason
Q27: Referring to Table 12-11, if the null
Q45: Referring to Table 11-7, the null hypothesis
Q70: Referring to Table 11-1, what type of
Q83: Referring to Table 11-10, the decision made
Q125: Referring to Table 12-17, the director should
Q136: Referring to Table 16-7, the Holt-Winters method
Q138: Referring to Table 12-3, the critical value
Q140: Referring to Table 13-3, suppose the director
Q203: Referring to Table 12-6, the null hypothesis