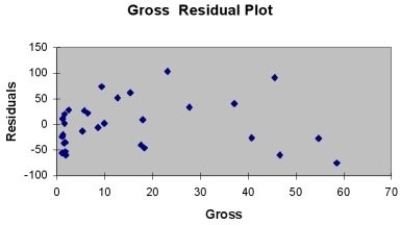
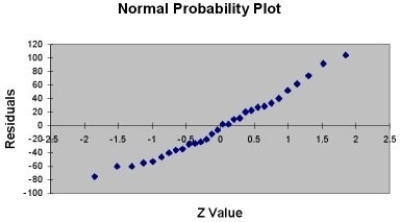
TABLE 13- 11
A company that has the distribution rights to home video sales of previously released movies would like to use the box office gross (in millions of dollars) to estimate the number of units (in thousands of units) that it can expect to sell. Following is the output from a simple linear regression along with the residual plot and normal probability plot obtained from a data set of 30 different movie titles:
ANOVA


-Referring to Table 13-11, what are, respectively, the lower and upper limits of the 95% confidence interval estimate for population slope?
Definitions:
Q31: Referring to Table 14-5, what is the
Q40: Referring to Table 15-8, what is the
Q76: The Variance Inflationary Factor (VIF) measures the<br>A)
Q97: Referring to Table 14-17, the null hypothesis
Q103: Referring to Table 12-17, what is the
Q126: Referring to Table 13-10, which is the
Q135: Referring to Table 14-8, the value of
Q150: Referring to Table 12-19, what is the
Q154: Referring to Table 11-11, the among-group variation
Q193: Referring to Table 13-11, what is the