TABLE 13-10
The management of a chain electronic store would like to develop a model for predicting the weekly sales (in thousands of dollars) for individual stores based on the number of customers who made purchases. A random sample of 12 stores yields the following results:
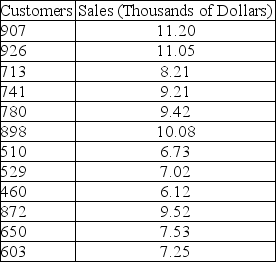
-Referring to Table 13-10, 93.98% of the total variation in weekly sales can be explained by the variation in the number of customers who make purchases.
Definitions:
Workers
Individuals engaged in a form of employment or labor, contributing their skills and efforts in exchange for financial compensation or wages.
Gas Tax
A tax imposed on the sale of gasoline, typically used to fund transportation and infrastructure projects.
Inelastic
Describes demand that is relatively unresponsive to price changes, meaning the percentage change in quantity demanded is smaller than that in price.
Consumers
Individuals or organizations that use economic goods and services generated within the economy, directly affecting demand trends and market dynamics.
Q45: Referring to Table 14-16, the alternative hypothesis
Q61: Referring to Table 12-13, there is sufficient
Q76: Referring to Table 12-9, what is the
Q77: Referring to Table 12-9, there is sufficient
Q94: Referring to Table 13-12, the degrees of
Q102: Referring to Table 13-4, the prediction for
Q138: Referring to Table 13-10, what is the
Q152: Referring to Table 13-2, to test that
Q177: In a two-way ANOVA, it is easier
Q193: Referring to Table 13-11, what is the