TABLE 13-10
The management of a chain electronic store would like to develop a model for predicting the weekly sales (in thousands of dollars) for individual stores based on the number of customers who made purchases. A random sample of 12 stores yields the following results:
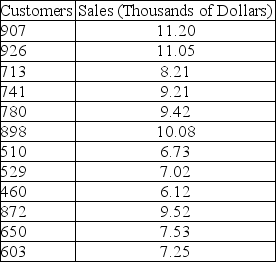
-Referring to Table 13-10, the p-value of the t test and F test should be the same when testing whether the number of customers who make purchases is a good predictor for weekly sales.
Definitions:
Budget Line
A visual depiction that shows all the different combinations of two products that can be bought within a specified budget, based on their current prices.
Highest Attainable
Refers to the best or most favorable outcome or state that can be achieved within given constraints.
Total Utility
The overall satisfaction or fulfillment a consumer receives from consuming a given quantity of goods and services.
Marginal Utility
This refers to the additional satisfaction or utility that a consumer receives from consuming one more unit of a good or service.
Q3: Referring to Table 14-15, the fitted model
Q12: The t test for the mean difference
Q38: Referring to Table 10-1, judging from the
Q54: Referring to Table 11-7, the agronomist decided
Q65: Referring to Table 12-9, there is sufficient
Q71: Referring to Table 11-4, the mean squares
Q113: Referring to Table 11-9, the mean square
Q129: If the Durbin-Watson statistic has a value
Q138: Referring to Table 13-10, what is the
Q212: Referring to Table 14-17, what is the