An investor wants to compare the risks associated with two different stocks. One way to measure the risk of a given stock is to measure the variation in the stock's daily price changes. The investor obtains a random sample of 20 daily price changes for stock 1 and 20 daily price changes for stock 2. These data are shown in the table below. Show how this investor can compare the risks associated with the two stocks by testing the null hypothesis that the variances of the stocks are equal. Use  = 0.10 and interpret the results of the statistical test.
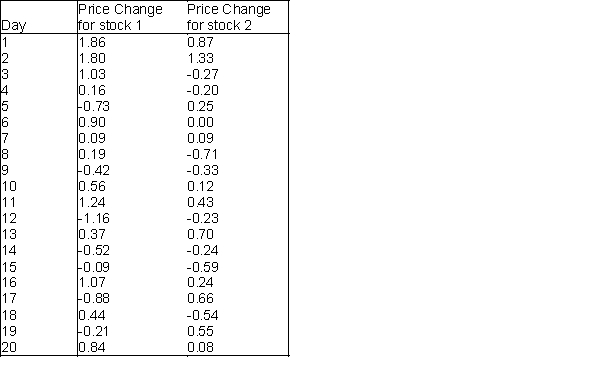
Definitions:
Demand for Health Care
The quantity of health-related services that consumers are willing and able to purchase at various prices, reflecting society's need for medical services.
Health Care as a Right
The principle that access to health care services should be universally available and not dependent on an individual's ability to pay.
Medical Technology
The application of scientific knowledge and devices to improve healthcare, including diagnostics, treatment, and patient care.
Medicare Subsidies
Financial support provided by the government to help lower the cost of Medicare for eligible individuals.
Q10: Samples of exam scores for employees before
Q24: Bayes Theorem is always based on two
Q32: Generate a risk profile for each of
Q39: A(n)_ is a collection of sample space
Q41: Selecting many different samples and running many
Q43: In the first step of setting up
Q49: Data that are collected by an individual
Q60: Much of the study of probabilistic inventory
Q69: The measurement in a sample or a
Q114: The higher the value of the density