The following values have been calculated using the T DIST and T INV functions in Excel®. These values come from a t- distribution with 15 degrees of freedom.
These values represent the probability to the right of the given positive values. 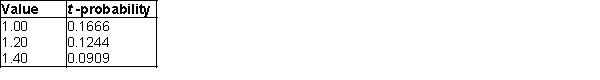 These values represent the positive t- value for a given probability in both tails (sum of both tails).
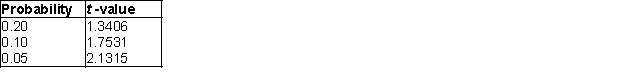
-What would be the t-value where 0.05 of the values are in the upper tail?
Definitions:
Q23: A relative frequency curve having a long
Q25: The number of items rejected daily by
Q31: Which of the following statements is true
Q40: A _ is a display of individual
Q40: A sample of size 20 is selected
Q45: Suppose a randomly selected patron is a
Q45: Only 5% of the students taking the
Q59: A restaurant stocks 600 hamburgers and 150
Q76: The rejection region is the set of
Q87: A frequency table includes row and column