The following values have been calculated using the T DIST and T INV functions in Excel®. These values come from a t- distribution with 15 degrees of freedom.
These values represent the probability to the right of the given positive values.  These values represent the positive t- value for a given probability in both tails (sum of both tails).
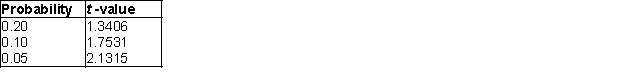
-What would be the t-values where 0.95 of the values would fall within this interval?
Definitions:
Rational Method
An approach based on reason and logic in decision-making or problem-solving, often involving systematic steps.
P-value
A statistical parameter that indicates whether the observed results of a study could occur by chance, typically used in hypothesis testing.
Null Hypothesis
A statistical hypothesis that assumes no significant difference or effect exists between certain characteristics or variables under investigation.
S Data
Information collected from self-reports used to understand individual perceptions or attitudes.
Q13: The binomial distribution deals with consecutive trials,
Q27: Determine the payoffs associated with each possible
Q30: A quantity that measures the variation of
Q36: A study is being conducted on the
Q50: The following is a relative frequency distribution
Q61: Stem-and-leaf displays and dot plots are useful
Q80: Quality control is an important issue at
Q88: If systematic sampling is chosen as the
Q107: According to the empirical rule, how many
Q109: The variance of a binomial distribution is