Q-Mart is interested in comparing customers who use its own charge card with those who use other types of credit cards. Q-Mart would like to know if customers who use the Q-Mart card spend more money per visit, on average, than customers who use some other type of credit cards. They have collected information on a random sample of 38 charge customers as shown below. On average, the person using a Q-Mart card spends $192.81 per visit and customers using another type of card spend $104.47 per visit. 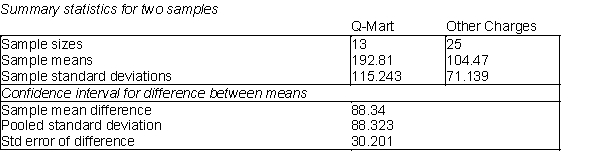
-(A) Using a t - value of 2.0281, calculate a 95% confidence interval for the difference between the average Q-Mart charge and the average charge on another type of credit card.
(B) What are the degrees of freedom for the t - multiple in this calculation? Explain how you would calculate the degrees of freedom in this case.
(C) What is the assumption in this case that allows you to use the pooled standard deviation for this confidence interval?
(D) Would you conclude that there is a significant difference between the two types of customers in this case? Explain.
Definitions:
Operating Revenues
Income generated from the core business activities of an entity excluding non-operating income sources.
Remeasurement
The process of converting foreign currency amounts into a functional currency using exchange rates that reflect changes in market conditions.
Translation
The process of converting the financial statements of a foreign subsidiary into the reporting currency of the parent company, according to appropriate accounting standards.
Purpose
The underlying motive or reason for the creation or existence of something.
Q4: Which of the following is a categorical
Q6: Exponential utility has an adjustable parameter called
Q9: In a statistics class,10 scores were randomly
Q20: A Type I error probability is represented
Q24: Find P(X = 2).
Q36: What is the probability that exactly half
Q57: If P(A) = P(A|B), then events A
Q60: If there are 120 values in a
Q63: Measurements from a population are called:<br>A)Elements.<br>B)Observations.<br>C)Variables.<br>D)Processes.
Q91: A probability tree is a graphical representation