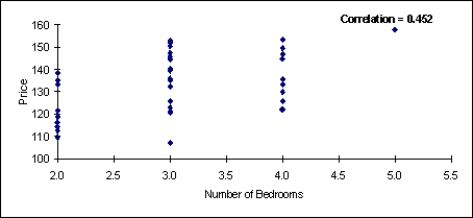
There are two scatterplots shown below. The first chart shows the relationship between the size of the home and the selling price. The second chart examines the relationship between the number of bedrooms in the home and its selling price. Which of these two variables (the size of the home or the number of bedrooms) seems to have the stronger relationship with the home's selling price? Justify your answer. 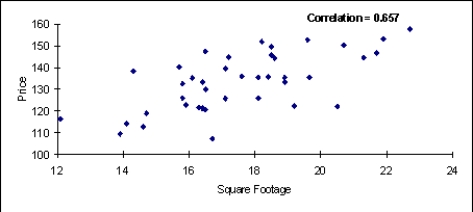
Definitions:
Q1: Using dummy variables is an efficient way
Q1: The random nature of games of chance
Q18: Which of the following is typically not
Q19: Assume that one of the bidders bids
Q47: A probability distribution is bounded if there
Q71: Comparing a numerical variable across two or
Q76: Using a strategy region graph, determine what
Q79: If we want to model a random
Q81: (A) Generate the "birthdays" of 30 different
Q100: Based on the histogram shown below, how