The data shown below contains family incomes (in thousands of dollars) for a set of 50 families sampled in 2007 and 2017. Assume that these families are good representatives of the entire United States. 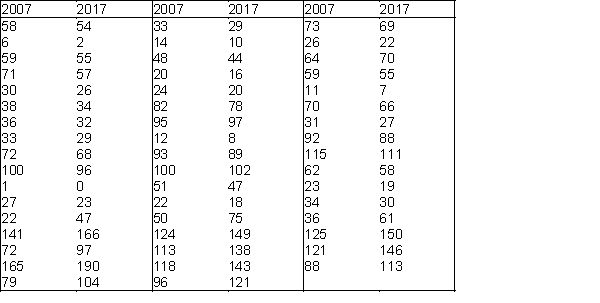
-Find the mean, median, standard deviation, first and third quartiles, and the 95th percentile for family incomes in both years.
Definitions:
Null Hypothesis
The assumption that no meaningful variation exists between defined groups, attributing any detected differences to random sampling or mistakes in the experiment.
Alternative Hypothesis
In statistical testing, a hypothesis that directly contradicts the null hypothesis, proposing that there is a significant difference or effect.
Random Sample
A method of selecting a subset of individuals from a population in which every individual has an equal chance of being chosen.
Financial Aid
Monetary support granted to students to help cover the costs associated with their education, such as tuition and living expenses.
Q5: Approximate the percentage of these Internet users
Q10: Probabilities that can be estimated from long-run
Q28: At time 0, you have $10,000. Investments
Q48: If P(A) = 0.25 and P(B) =
Q52: Are the empirical rules applicable in this
Q54: What is the expected number of bats
Q54: A data set from a sample of
Q80: Statisticians often refer to the pivot tables
Q85: Explain why the ratio of the average
Q103: Find the mean and standard deviation of