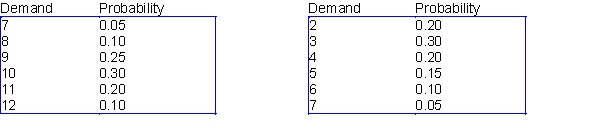
Oregon State University has reached the final four in the 2016 NCAA Women's Basketball Tournament, and as a result, a sweatshirt supplier in Corvallis is trying to decide how many sweatshirts to print for the upcoming championships. The final four teams (Oregon State, University of Washington, Syracuse, and University of Connecticut) have emerged from the quarterfinal round, and there is a week left until the semifinals, which are then followed in a couple of days by the finals. Each sweatshirt costs $12 to produce and sells for $24. However, in three weeks, any leftover sweatshirts will be put on sale for half price, $12. The supplier assumes that the demand (in thousands) for his sweatshirts during the next three weeks, when interest is at its highest, follows the probability distribution shown in the table below. The residual demand, after the sweatshirts have been put on sale, also has the probability distribution shown in the table below. The supplier realizes that every sweatshirt sold, even at the sale price, yields a profit. However, he also realizes that any sweatshirts produced but not sold must be thrown away, resulting in a $12 loss per sweatshirt.
Demand distribution at regular price Demand distribution at reduced price
-(A) Assume that the weight of each can in a six-pack has a 0.8 correlation with the weight of the other cans in the six-pack. What mean fill quantity (within 0.05 ounce) maximizes expected profit per six-pack?
(B) If the weights of the cans in the six-pack are probabilistically independent, what mean fill quantity (within 0.05 ounce) will maximize expected profit per six-pack?
(C) How can you explain the difference in the answers for (A) and (B)?
Definitions:
Q8: Mya is investigating the factors that impact
Q12: Which p-value from a two-way ANOVA table
Q15: Both ordinal and nominal variables are categorical.
Q18: Structure query language (SQL):<br>A) is the "language
Q33: Examples of comparison problems include:<br>A) salary broken
Q38: How is the median defined if the
Q39: Suppose the bonus for completing the project
Q43: What is the probability that your portfolio
Q47: Simulate Amanda's portfolio over the next 30
Q57: To examine relationships between two categorical variables,