Nancy, Inc. manufactures 4 ounce chocolate bars. Random samples of size four were taken and weighed. Eight hours of observation provided the following data. 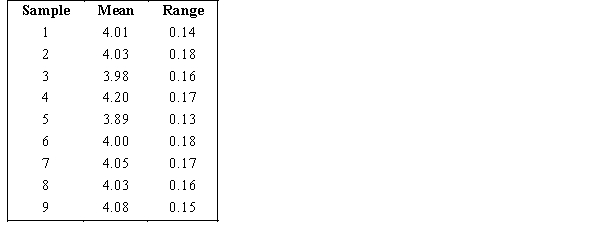
a. Determine the 3 sigma upper and lower control limits for the x-bar chart.
b. Determine the 3 sigma upper and lower control limits for the R-chart.
Definitions:
Q24: Refer to Exhibit 15-6. We want
Q25: A Composite price index where the prices
Q26: Actual sales for January through April are
Q32: Which of the following tests would not
Q52: A qualitative forecasting method that obtains forecasts
Q65: Below you are given the first two
Q66: In a multiple regression model, the
Q102: In regression analysis, if the independent variable
Q127: Refer to Exhibit 14-4. To perform an
Q146: Compared to the confidence interval estimate for