Exhibit 16-1
In a regression analysis involving 25 observations, the following estimated regression equation was developed. 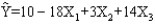 Also, the following standard errors and the sum of squares were obtained.
Sb1 = 3
Sb2 = 6
Sb3 = 7
SST = 4,800
SSE = 1,296
-Refer to Exhibit 16-1. If we are interested in testing for the significance of the relationship among the variables (i.e., significance of the model) the critical value of F at = 0.05 is
Definitions:
Satisfaction
The fulfillment or gratification of a need, desire, or appetite, often used in the context of consumer experiences with goods or services.
Demand Curve
A visual depiction showing how the quantity of a product demanded by buyers varies with its price.
Horizontal Summation
A method used to determine the total market demand or supply by adding together the quantities demanded or supplied at each price by all individuals.
Substitution Effect
The change in consumption patterns due to a change in the relative prices of goods.
Q2: Two faculty members ranked 12 candidates for
Q10: Refer to Exhibit 12-2. At 95% confidence,
Q14: Refer to Exhibit 17-2. The unweighted aggregate
Q23: In regression analysis, an outlier is an
Q30: Refer to Exhibit 21-2. The expected value
Q33: A survey of an entire population is
Q49: Refer to Exhibit 12-6. At 95% confidence,
Q58: Marascuillo procedure is used for testing the
Q71: Refer to Exhibit 14-8. The total sum
Q144: Below you are given a partial