Consider the following data. 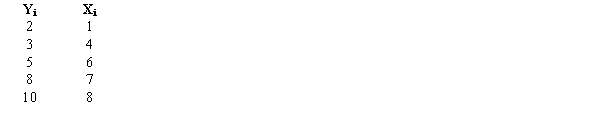
a.Draw a scatter diagram. Does the relationship between X and Y appear to be linear?
b.Assume the relationship between X and Y can best be given by  Estimate the parameters of this curvilinear function.
Definitions:
Independent Samples
Two or more groups of data that are not related or influenced by the same variables, allowing for comparisons between the groups in statistical analysis.
Confidence Interval
A range of values derived from sample statistics that is likely to contain the value of an unknown population parameter with a specified probability.
Mean Time
An average or expected time that represents the central tendency of a set of times.
True Proportions
Refer to the actual relative frequencies of outcomes within a population.
Q13: Given an actual demand of 61, forecast
Q16: Refer to Exhibit 13-5. If at 95%
Q28: Refer to Exhibit 19-3. The null hypothesis
Q30: Refer to Exhibit 19-2. The null
Q54: Refer to Exhibit 15-6. The interpretation of
Q57: The critical F value with 8
Q67: A method of smoothing a time series
Q70: Refer to Exhibit 15-8. The yearly income
Q90: Refer to Exhibit 14-10. The point estimate
Q119: Refer to Exhibit 14-1. The least squares