Exhibit 16-1
In a regression analysis involving 25 observations, the following estimated regression equation was developed. 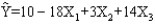 Also, the following standard errors and the sum of squares were obtained.
Sb1 = 3
Sb2 = 6
Sb3 = 7
SST = 4,800
SSE = 1,296
-Refer to Exhibit 16-1. The p-value for testing the significance of the regression model is
Definitions:
Doing Business
Engaging in activities that generate revenue or provide services in exchange for monetary compensation.
Peoria
A reference often used metaphorically to mean the average American city or the general opinion of mainstream America.
Public Service Announcement
A message broadcasted to the public to inform or educate about an issue of public interest, often sponsored by a government or nonprofit organization.
Public Welfare Issues
Social concerns and problems that affect the general well-being and health of the population, often addressed by government policies and programs.
Q7: Refer to Exhibit 17-3. The Laspeyres index
Q9: A sample of 5 clusters is to
Q11: Refer to Exhibit 17-1. The weighted aggregate
Q18: Refer to Exhibit 14-9. The sample correlation
Q19: Fifteen people were asked to indicate
Q39: The makers of Compute-All know that in
Q49: Refer to Exhibit 12-6. At 95% confidence,
Q60: Refer to Exhibit 19-3. The test statistic
Q84: Refer to Exhibit 14-10. The coefficient of
Q107: Part of an Excel output relating X