Exhibit 16-2
In a regression model involving 30 observations, the following estimated regression equation was obtained. 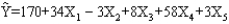 For this model, SSR = 1,740 and SST = 2,000.
-Refer to Exhibit 16-2. The degrees of freedom associated with SST are
Definitions:
Test Period
A specific duration of time designated for the purpose of conducting tests, assessments, or experiments to evaluate performance, effectiveness, or reliability.
Histogram
A graphical representation of the distribution of numerical data, usually shown as bars of different heights.
Positively Skewed
Describes a distribution of numerical data where the right tail is longer or fatter than the left, indicating that the majority of values are concentrated on the left side of the distribution.
Negatively Skewed
Describes a distribution where the tail is on the left side of the distribution, indicating that the majority of data points are concentrated on the right side.
Q12: The critical F value with 6
Q22: Ten drivers were asked to drive
Q22: A multiple regression model has the form
Q29: A production process is set up
Q38: The entity on which data are collected
Q52: The collection of statistical methods that require
Q74: Refer to Exhibit 15-3. The computed F
Q75: Below you are given information on
Q95: Random samples of several days' sales of
Q114: A regression analysis between sales (Y in