Exhibit 15-2
A regression model between sales (Y in $1,000) , unit price (X1 in dollars) and television advertisement (X2 in dollars) resulted in the following function: 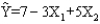 For this model SSR = 3500, SSE = 1500, and the sample size is 18.
-Refer to Exhibit 15-2. To test for the significance of the model, the test statistic F is
Definitions:
Performance Discrepancy
The gap between expected and actual performance levels in the workplace.
Managerial Potential
Describes the capability and likelihood of an individual to succeed in management roles, based on qualities like leadership, decision-making, and communication skills.
Technical Skills
Specific abilities and knowledge required to perform practical tasks in specialized fields, involving complex processes or equipment.
Formal Education Programs
Structured courses of study or training provided by educational institutions or organizations leading to certification, a diploma, or a degree.
Q6: An important application of the chi-square distribution
Q25: A production process that is in
Q32: Refer to Exhibit 22-1. The point estimate
Q47: Among 1,000 managers with degrees in
Q57: The manager of a company believes that
Q61: Refer to Exhibit 16-1. The test statistic
Q70: We are interested in determining whether or
Q79: The coefficient of determination<br>A)cannot be negative<br>B)is the
Q99: Shown below is a partial computer
Q138: Refer to Exhibit 14-7. The least squares