Multiple Choice
Exhibit 15-6
Below you are given a partial computer output based on a sample of 16 observations. 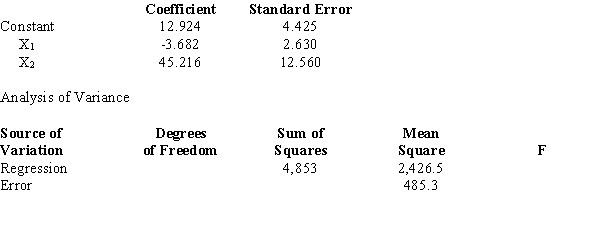
-Refer to Exhibit 15-6. The test statistic used to determine if there is a relationship among the variables equals
Recognize the importance of patient preferences, abilities, and cultural sensitivity in care planning and intervention selection.
Define and differentiate between types of interventions (e.g., health promotion, treatment, prevention).
Describe the role of critical pathways in standardizing care for frequently occurring conditions.
Acknowledge the client as the primary decision-maker in the care for healthy adult clients.
Definitions:
Related Questions
Q10: Nodes indicating points where an uncertain event
Q35: Refer to Exhibit 18-2. The slope of
Q36: Refer to Exhibit 13-3. The mean square
Q49: Below you are given some values of
Q60: Independent simple random samples are taken to
Q65: In order to determine whether or not
Q70: We are interested in determining whether or
Q82: Refer to Exhibit 13-5. The test statistic
Q87: Refer to Exhibit 14-7. The coefficient of
Q106: If the coefficient of correlation is a