Multiple Choice
Exhibit 15-6
Below you are given a partial computer output based on a sample of 16 observations. 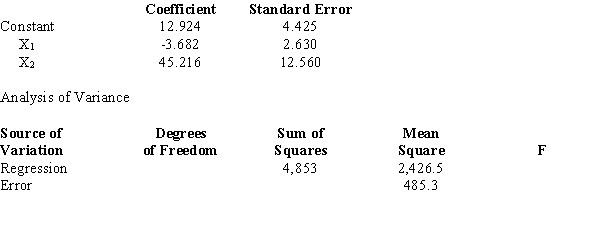
-Refer to Exhibit 15-6. Carry out the test to determine if there is a relationship among the variables at the 5% level. The null hypothesis should
Definitions:
Related Questions
Q5: Refer to Exhibit 18-3. The intercept, b<sub>0</sub>,
Q27: Refer to Exhibit 22-2. An approximate 95%
Q29: A production process is set up
Q33: Refer to Exhibit 15-8. If we want
Q40: Refer to Exhibit 18-2. The forecast for
Q42: Refer to Exhibit 15-6. The t value
Q50: The 99% confidence interval estimate for a
Q52: Refer to Exhibit 21-4. The expected monetary
Q71: A sample of 25 families was
Q95: Random samples of several days' sales of