Shown below is a portion of a computer output for a regression analysis relating supply (Y in thousands of units) and unit price (X in thousands of dollars). 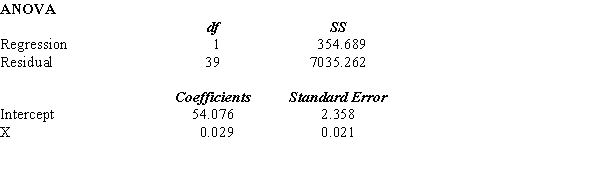
a. What has been the sample size for this problem?
b. Perform a t test and determine whether or not supply and unit price are related. Let = 0.05.
c. Perform and F test and determine whether or not supply and unit price are related. Let = 0.05.
d. Compute the coefficient of determination and fully interpret its meaning. Be very specific.e. Compute the coefficient of correlation and explain the relationship between supply and unit price.f. Predict the supply (in units) when the unit price is $50,000.
Definitions:
Americans
Refers to the citizens or natives of the United States, often in the context of discussing national identity, culture, or social issues.
Product Differentiation
A marketing strategy that businesses use to distinguish their products from similar offerings in the market by highlighting unique features, quality, or brand.
Out-of-Print Books
Books that are no longer being published or available for sale through normal distribution channels, often due to low demand or relevance.
Cornfield
A field in which corn is grown, often symbolizing areas of agricultural farming.
Q28: Refer to Exhibit 10-12. The standard error
Q40: The value of F<sub>0.01</sub> with 9 numerator
Q41: Refer to Exhibit 13-6. The conclusion of
Q47: Among 1,000 managers with degrees in
Q50: Testing the equality of three or more
Q51: Refer to Exhibit 18-2. The forecast for
Q54: In order to estimate the difference between
Q75: Below you are given information on
Q78: Six observations were selected from each
Q94: Independent random samples taken on two