The following data shows the yearly income (in $1,000) and age of a sample of seven individuals. 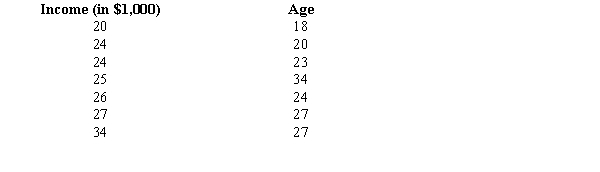
a.Develop the least squares regression equation.
b.Estimate the yearly income of a 30-year-old individual.
c.Compute the coefficient of determination.
d.Use a t test to determine whether the slope is significantly different from zero. Let = 0.05.
e.At 95% confidence, perform an F test and determine whether or not the model is significant.
Definitions:
Diversity
The inclusion of individuals from a variety of backgrounds, perspectives, and abilities in a group or organization.
Quotas
Preset limits or targets for a specific measurement, such as production, immigration, or tariffs, within a given timeframe.
Discrimination
Unjust or prejudicial treatment of different categories of people, especially on the grounds of race, age, sex, or disability.
Single parent
An individual who raises a child or children without the assistance of a partner, typically in a sole caretaker role.
Q3: Regression analysis was applied between sales (in
Q12: We are interested in testing whether
Q27: Which of the following smoothing constants would
Q28: Demand for a product and the forecasting
Q31: The time series component that reflects gradual
Q49: In a sample of 100 Republicans, 60
Q59: A least squares regression line<br>A)may be used
Q62: Regression analysis was applied between demand for
Q77: It is believed that the median age
Q146: For a one-tailed hypothesis test (upper tail)