Multiple Choice
Exhibit 13-3
To test whether or not there is a difference between treatments A, B, and C, a sample of 12 observations has been randomly assigned to the 3 treatments. You are given the results below. 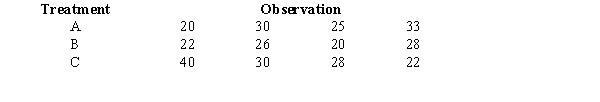
-Refer to Exhibit 13-3. The null hypothesis is to be tested at the 1% level of significance. The p-value is
Definitions:
Related Questions
Q3: Refer to Exhibit 12-3. The expected frequency
Q5: As the test statistic becomes larger, the
Q40: Test scores on a standardized test from
Q44: Refer to Exhibit 16-2. The value of
Q51: The numerical value of the coefficient of
Q63: A student believes that the average
Q66: In a multiple regression model, the
Q96: Read the Z statistic from the normal
Q98: Last year, a soft drink manufacturer had
Q120: Refer to Exhibit 14-3. The sample correlation