The following data represent the daily supply (y in thousands of units) and the unit price (x in dollars) for a product. 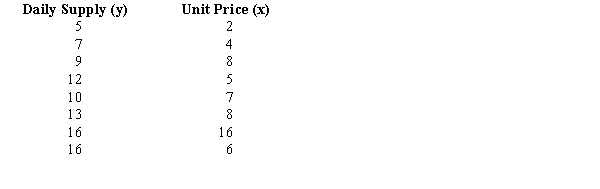
a.Compute and interpret the sample covariance for the above data.
b.Compute the standard deviation for the daily supply.
c.Compute the standard deviation for the unit price.
d.Compute and interpret the sample correlation coefficient.
Definitions:
Producer Surplus
The difference between the current market price and the cost of production for the firm.
Market Price
The current price at which a good or service can be bought or sold in the open market.
Costs Of Production
The total expenses incurred in producing goods or services, including raw materials, labor, and overheads.
Willingness To Sell
The minimum price at which a person or entity is prepared to sell a good or service, reflecting the value at which they are ready to part with it.
Q5: Four workers at a fast food restaurant
Q16: Refer to Exhibit 1-1. The city manager
Q19: What cause is suggested by the information
Q20: The key problem underlying the discovery of
Q31: Refer to Exhibit 5-8. The probability that
Q61: Income is an example of<br>A)categorical data<br>B)either categorical
Q105: The standard deviation of a sample was
Q121: A survey of a sample of business
Q139: Which of the following symbols represents
Q172: The following data shows the number of