In its 2000 report, a company presented the following data regarding its sales (in millions of dollars), and net income (in millions of dollars). The bar chart below was used to present these data. 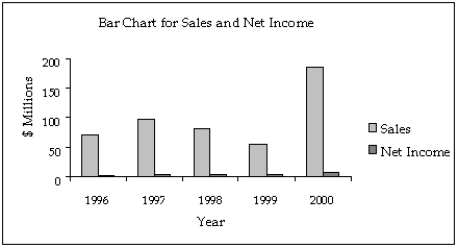 Assume that you are an unscrupulous statistician and want to make the data appear more positive than they really are. Redraw the graph by being selective about which years to include, getting the desired effect.
Definitions:
Satisfied
The feeling of contentment or pleasure in fulfilling desires or needs.
Partners
Individuals who engage in a shared business or personal relationship, characterized by mutual cooperation and responsibility.
Never-married Mothers
Women who have children but have never been legally married, highlighting a specific demographic in societal studies.
Health
A condition of total health encompassing physical, psychological, and social aspects, beyond simply being free from illness or weakness.
Q1: Perform the indicated operations and simplify.
Q4: {Hobby Shop Sales Narrative} What is the
Q16: Excluding some members of the target population
Q34: Briefly explain the difference between correlation and
Q44: What are the two most important characteristics
Q88: {GPA and Class Narrative} What is the
Q131: The intervals (classes) in a histogram are
Q161: Choose the proper symbol <img src="https://d2lvgg3v3hfg70.cloudfront.net/TB1243/.jpg" alt="Choose
Q222: If event A and event B cannot
Q298: Simplify the expression so that it contains