NARRBEGIN: Home Care
Home Care
Data are collected on the number of house calls (x) made in a given week by each of 60 nurses in a certain hospital. The same data set is displayed in each of the three histograms below. 

 NARREND
-The line chart below shows tomato prices each month from January (month 1) to December last year ($ per pound). By looking at this chart you can see the lowest tomato prices occurred in July. 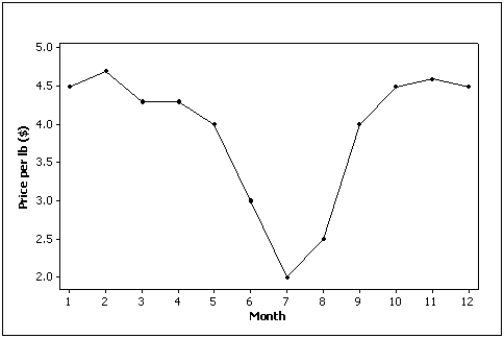
Definitions:
Q1: To give away a door prize, the
Q51: Which of the following describes selection bias?<br>A)A
Q60: {Milk Demand Narrative} If the supermarket begins
Q61: A self-selected sample is one in which
Q89: {Strip Mall Rent Narrative} Compute the sample
Q110: What statistics and graphs can you use
Q122: The collection of all possible outcomes of
Q188: In many applications, it is often necessary
Q250: Evaluate the following expression. <img src="https://d2lvgg3v3hfg70.cloudfront.net/TB1243/.jpg"
Q289: Evaluate the following expression if it represents