NARRBEGIN: Home Care
Home Care
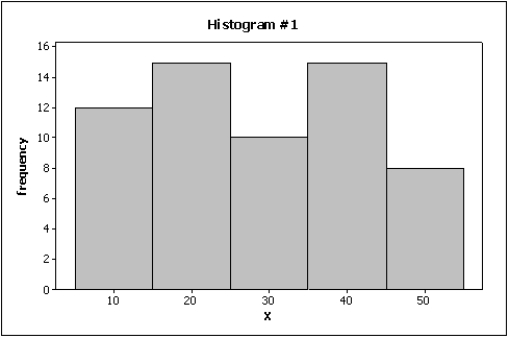
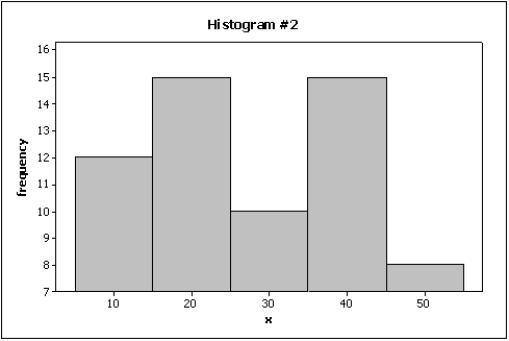
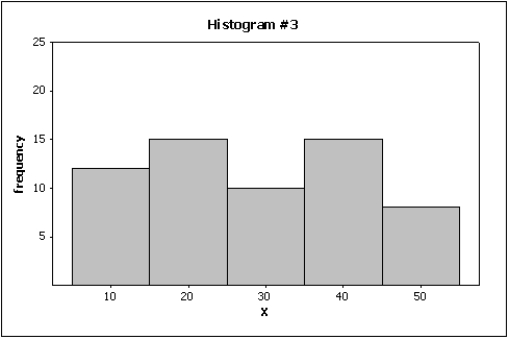
Data are collected on the number of house calls (x) made in a given week by each of 60 nurses in a certain hospital. The same data set is displayed in each of the three histograms below. 

 NARREND
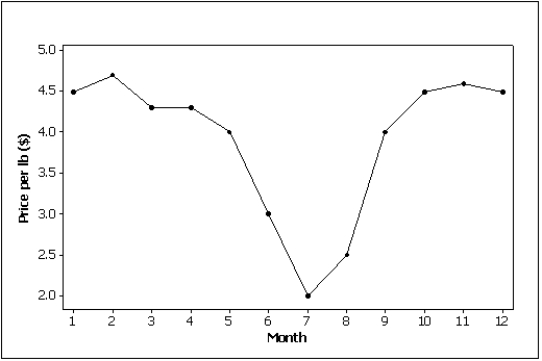
-Beef prices throughout the year (month 1 = January) are shown in the line chart below (per pound). Describe beef prices for this given year using this line chart. 
Definitions:
Starting Salary
The amount of money that a new employee is paid at the beginning of their employment.
SPSS Regression Output
The results generated by the statistical software SPSS after performing regression analysis, including coefficients, significance levels, and other diagnostics.
Y-intercept
The point where a line crosses the y-axis on a graph, representing the value of the dependent variable when the independent variable is zero.
Simple Linear Regression
A statistical method that models the relationship between a dependent variable and one independent variable by fitting a linear equation to the observed data.
Q19: Whether or not you are over the
Q53: If the distribution of a data set
Q81: Find <img src="https://d2lvgg3v3hfg70.cloudfront.net/TB1243/.jpg" alt="Find ,
Q121: {Teachers Ages Narrative} Construct an ogive for
Q136: The number of hours a college student
Q141: The mean of fifty sales receipts is
Q166: Compute and simplify so that only positive
Q182: Graphical and numerical techniques, such as histograms
Q202: There are three statistics used to measure
Q289: Evaluate the following expression if it represents