Multiple Choice
The following tables give the death rates, per 100,000 population, by age for selected years for males and females. If matrix M gives the male data and matrix F gives the female data, find matrix M - F and describe what it means.
Males 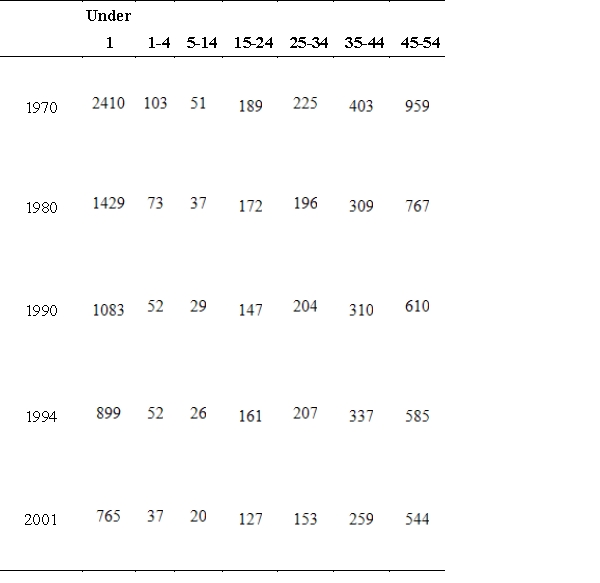 Females
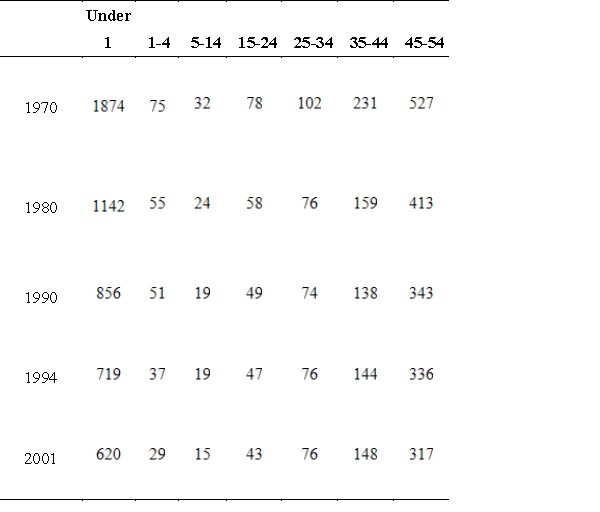
Definitions:
Related Questions
Q19: Suppose a primal minimization problem and its
Q22: The time t, in seconds, that it
Q43: Factor the expression as a product of
Q58: Write the augmented matrix associated with the
Q65: A company manufactures two types of electric
Q66: Use the simplex method to maximize the
Q95: Use the following matrices to perform the
Q113: One safe investment pays 10% per year,
Q129: Find the interest that will result if
Q242: Factor by finding the common monomial factor.