The following figure shows a graph that compares the present values of two ordinary annuities of $800 quarterly as functions of the number of quarters. One annuity is at an annual rate of 6% compounded quarterly, and the other is at 9% compounded quarterly. What present value is required to purchase an annuity of $800 a quarter for 25 years with an interest rate of 9% compounded quarterly? Check your answer against the graph. Round your answer to the nearest cent. 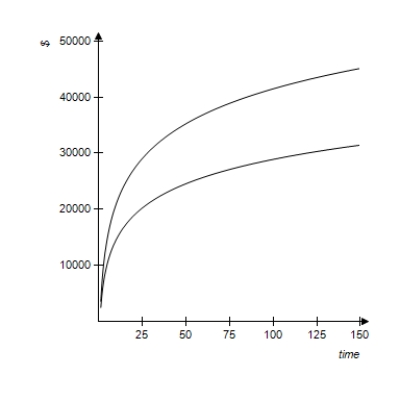
Definitions:
Taxonomic Groups
Categories used in the classification of organisms, arranged in a hierarchical system that ranges from broad to specific, such as kingdom, phylum, class, order, family, genus, and species.
Fossil Record
The collection of fossils, which are the preserved remains or imprints of organisms, providing historical evidence of life on Earth.
Bacteria
Microscopic single-celled organisms that can be found in various environments, some of which can cause disease while others are beneficial.
Mammals
A class of warm-blooded vertebrate animals characterized by the presence of mammary glands which in females produce milk for feeding their young.
Q2: In the analysis of traffic flow, a
Q8: $3,300 is invested for 8 months at
Q10: When a firm buys another company, the
Q14: The graph of the boundary equations for
Q15: Suppose a primitive economy consists of two
Q18: Suppose the probability that a certain drug
Q48: Suppose an ice cream store offers 34
Q49: Graph the inequality. <img src="https://d2lvgg3v3hfg70.cloudfront.net/TB1243/.jpg" alt="Graph the
Q84: Use the simplex method to maximize the
Q117: A Markov chain has transition matrix <img