Multiple Choice
The percents of total households that contain married couples for the years 1982 to 2006 are given in the table below. Construct a frequency histogram of the percents. 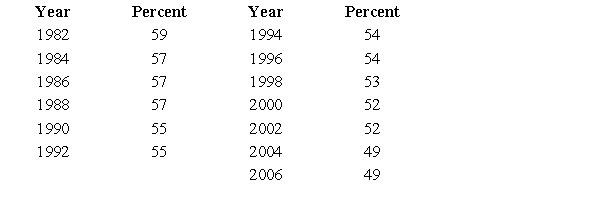
Definitions:
Related Questions
Q10: A young couple buying their first home
Q11: Use the graph shown in the figure
Q13: Graph the function with a graphing utility
Q24: Graph the function <img src="https://d2lvgg3v3hfg70.cloudfront.net/TB1243/.jpg" alt="Graph the
Q35: Express <img src="https://d2lvgg3v3hfg70.cloudfront.net/TB1243/.jpg" alt="Express in
Q36: The sales of a product S (in
Q39: A recent college graduate buys a new
Q52: A function and its first and second
Q66: Write the equation in exponential form.
Q71: A certain model of automobile has its