The graph in the following figure gives the times that it takes a vehicle to reach speeds from 0 mph to 25 mph, in increments of 5 mph, with a curve connecting them. Count the squares under the curve to estimate this distance. Estimate the distance traveled by the vehicle in 14 seconds, to a speed of 25 mph. (Be careful with time units.) 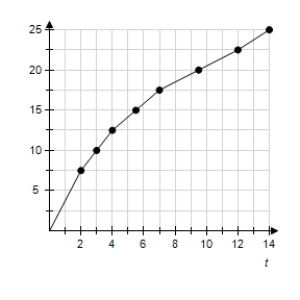
Definitions:
Q3: If <img src="https://d2lvgg3v3hfg70.cloudfront.net/TB1243/.jpg" alt="If ,
Q27: Evaluate the integral <img src="https://d2lvgg3v3hfg70.cloudfront.net/TB1243/.jpg" alt="Evaluate the
Q34: Find the relative minima, and use a
Q43: Give the domain of the function <img
Q48: An inferior product with a large advertising
Q59: Use rectangles to find the area between
Q87: Suppose that a liquid carries a drug
Q100: Find x and y such that <img
Q150: A firm can produce 100 units per
Q166: Find the indicated derivative. If <img src="https://d2lvgg3v3hfg70.cloudfront.net/TB1243/.jpg"