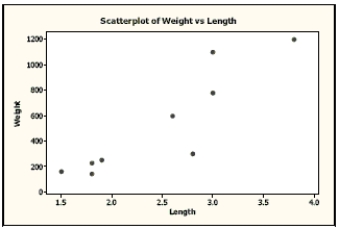
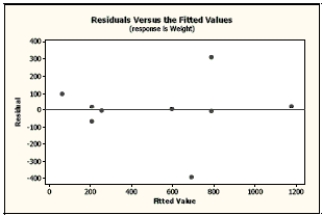
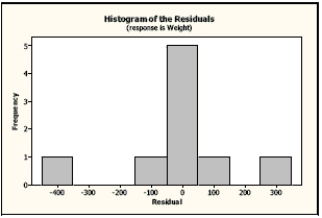
Carnivores A random sample of some of the heaviest carnivores on Earth was reviewed to determine if there is an association between the length (in meters) and weight (in kilograms) of these carnivores. Here are the scatterplot, the residuals plot, a histogram of the residuals, and the regression analysis of the data. Use this information to analyze the association between the length and weight of these carnivores.
The regression equation is
Weight Length
a. Is there an association? Write appropriate hypotheses.
b. Are the assumptions for regression satisfied? Explain.
c. What do you conclude?
d. Create a 98% confidence interval for the true slope.
e. Explain in context what your interval means.
Definitions:
Nitrogen
A chemical element with symbol N and atomic number 7, it is a non-metallic gas that makes up 78% of the Earth's atmosphere by volume.
Formula
A symbolic representation of the composition of a compound, indicating the elements present and the ratio of atoms or ions.
Cyanate Ion
A negatively charged ion or anion with the formula OCN-, derived from cyanic acid.
Cyanide Ion
An anion with the formula CN−, known for its high toxicity, it can form various inorganic and organic compounds.
Q18: Individual investors trade conservatively, given the difficulty
Q29: Do you think a model could accurately
Q32: A share market comprises 2000 shares of
Q36: A corporate raider gains a controlling fraction
Q36: Describe how you will use a random
Q45: Would you make the same conclusion as
Q62: A soft drink company is conducting
Q64: If a share pays dividends at
Q68: The price of BHP is $40 per
Q69: The systematic risk (beta) of a portfolio