A sports analyst was interested in finding out how well a football team's winning percentage (stated as a proportion) can be predicted based upon points scored and points allowed. She selects a random sample of 15 football teams. Each team played 10 games. She decided to use the point differential, points scored minus points allowed as the predictor variable. The data are shown in the table below, and regression output is given afterward.
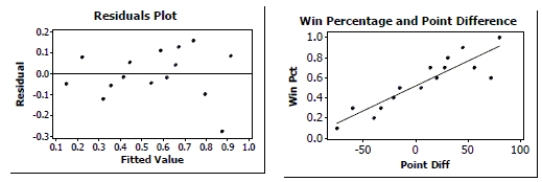
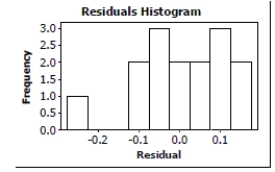
Is there evidence of an association between Point Differential and Winning Percentage? Test an appropriate hypothesis and state your conclusion in the proper context.
Definitions:
Simple Rate Of Return
A calculation that measures the percentage return on an investment or project, not accounting for the complexity of interest compounding.
Cash Operating Expenses
Expenses that a company pays out in cash during an operational period, including salaries, utilities, and rent, but excluding non-cash expenses like depreciation.
Annual Depreciation
The allocation of an asset's cost over its useful life, representing how much of an asset's value has been used up during a fiscal year.
Simple Rate Of Return
A straightforward method of calculating the return on investment by dividing annual incremental net operating income by the initial investment cost.
Q40: Peanut M&Ms According to the Mars Candy
Q45: A study of trading behaviour of individual
Q48: The beta of the market portfolio is?<br>A)
Q57: Hamsters You have ten hamsters. Their weights
Q59: Survey. A local news station wants to
Q63: Company executives wish to estimate the dollar
Q68: An online catalog company wants on-time
Q95: A consultant talked the group into gathering
Q101: Describe an advantage of the placebo.
Q103: A certain population is strongly skewed to