Of the 23 first year male students at State U. admitted from Jim Thorpe High School, 8 were offered baseball scholarships and 7 were offered football scholarships. The University admissions committee looked at the students' composite ACT scores (shown in table), wondering if the University was lowering their standards for athletes. Assuming that this group of students is representative of all admitted students, what do you think?
Boxplots: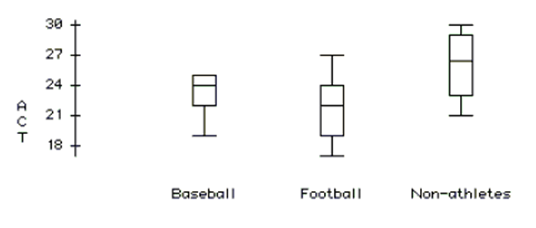
Normal Probability Plot: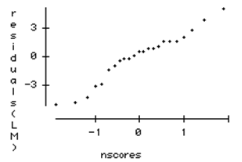
-Are the two sports teams mean ACT scores different?
Definitions:
True Average Age
The actual mean age of a group or population, accurately representing the central tendency without bias.
Sample Size
The number of observations or units in a sample taken from a population for the purpose of statistical analysis.
Critical Value
A threshold value that is compared with the test statistic to determine whether the null hypothesis should be rejected in hypothesis testing.
True Average Weight
The actual mean weight calculated across a specified population or sample.
Q8: Fortescue had realised returns of 10%, 25%,
Q25: If the returns on a share index
Q29: Gas mileage Hoping to improve the
Q37: For more accurate cost determination, the insurance
Q42: Joe is a general partner in a
Q56: If asset A's return is exactly two
Q67: Which is true about a 99% confidence
Q69: On the axes below, sketch a scatterplot
Q76: What is the probability that she does
Q91: If you have a puppy who