Time Wasted A group of students decide to see if there is link between wasting time on the internet and GPA. They don't expect to find an extremely strong association, but they're hoping for at least a weak relationship. Here are the findings.
a. How strong is the relationship the students found? Describe in context with statistical justification.
One student is concerned that the relationship is so weak, there may not actually be any relationship at all. To test this concern, he runs a simulation where the 10 GPA's are randomly matched with the 10 hours/week. After each random assignment, the correlation is calculated. This process is repeated 100 times. Here is a histogram of the 100 correlations. The correlation coefficient of -0.371 is indicated with a vertical line. 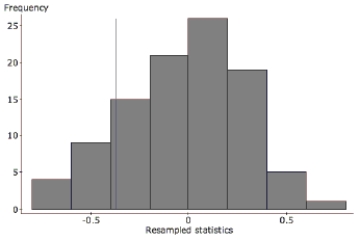
b. Do the results of this simulation confirm the suspicion that there may not be any relationship? Refer specifically to the graph in your explanation.
Definitions:
Credit Price
The cost associated with borrowing money or purchasing goods and services on credit, including interest and fees.
Discount Percent
The percentage by which the price of an item is reduced from its original price.
Percentage Cost
The cost of something expressed as a percentage of another amount, often used in calculating interest rates, commissions, or efficiency ratios.
Credit Report
A detailed report of an individual's credit history prepared by a credit bureau, used by lenders to determine creditworthiness.
Q8: We test the hypothesis that p =
Q11: If the odds of the Yankees beating
Q13: What cause is suggested by the information
Q22: When we say that an electric current
Q29: Should the company conclude that the percentage
Q33: A condition X is not a sufficient
Q54: The relationship between the longevity of an
Q58: The ages of people attending the opening
Q64: What is the term for the applicable
Q74: Create and interpret a 90% confidence interval.