Which is true of the data shown in the histogram?
I. The distribution is skewed to the right.
II. The mean is probably smaller than the median.
III. We should use median and IQR to summarize these data. 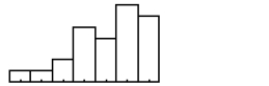
Definitions:
Time Constants
The time required for a system to change significantly from one state to another, often used in the context of charging and discharging in RC (Resistor-Capacitor) and RL (Resistor-Inductor) circuits.
Charge Curve
A graphical representation of the charge of a battery or capacitor over time, often showing how charge varies with charging or discharging processes.
Dielectric Constant
A method of determining the insulation properties of a dielectric using air as a reference.
Rated Value
Rated value indicates the maximum or nominal performance specification for which a device or component is designed, such as voltage, power, or temperature.
Q4: Morgan discovers 6 acquaintances who bought Goodmonth
Q10: What is the standard deviation of their
Q15: Suppose, to select a sample from a
Q21: What cause is suggested by the information
Q27: Write a sentence or two about the
Q29: An example of faked evidence is provided
Q60: If a data point is influential it……<br>A)
Q67: Given the following premises:<br>1)∼D ∨ ∼T<br>2)D ∨
Q67: This regression analysis examines the relationship
Q179: Given the argument: G ⊃ (N •