The chart shows the number of research articles in the prominent journal Physics Review that were written by researchers in Europe during 1983 - 2003 ( represents 1983) . 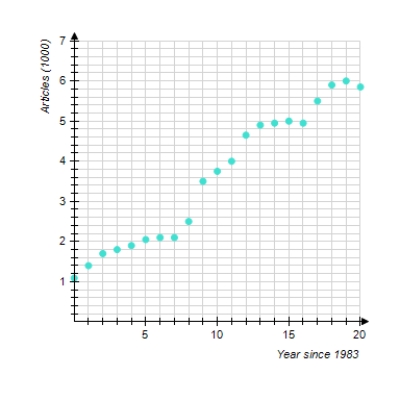
Which of the following logistic functions best models the data ( t is the number of years since 1983.) Try to determine the correct model without actually computing data points.
Definitions:
Publication Information
Details regarding the publication of a document or book, including the publisher, date of publication, and ISBN.
Primary Research
The process of gathering new data directly from original sources for a specific research purpose, as opposed to analyzing existing data.
Costly Research Efforts
Investment in research activities that require significant resources, both financial and time, often for complex or innovative investigations.
Analytical Report
A document that presents a detailed examination and analysis of a specific issue or problem.
Q10: Find the present value of the decreasing
Q17: Use Gauss-Jordan row reduction to solve
Q35: Find the best-fit line associated with
Q44: The Megabucks Corporation is issuing a 20-year
Q60: If the addition or subtraction of
Q74: Two sectors of some economy are
Q85: Graph the function.
Q122: Determine the periodic payment for a loan
Q129: Calculate <span class="ql-formula" data-value="\frac {
Q140: Find the coefficient of correlation of