Consider the following graph. What would cause a downward shift of the production function? 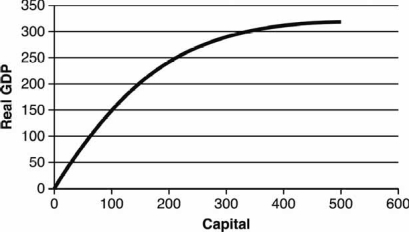
Definitions:
Labor Market
The marketplace where employers find workers and workers find jobs, characterized by the supply and demand for labor.
Price Elastic
Describing a situation where the demand for a product is sensitive to price changes, meaning a relatively small change in price leads to a large change in the quantity demanded.
Supply Curve
A graph that details the interaction between the price level of a commodity and the quantity of it provided.
Per-unit Tax
A tax imposed on each unit of a good or service sold, affecting the supply curve by increasing production costs.
Q53: The price index used to illustrate the
Q68: What is the market value of a
Q95: When considering nominal gross domestic product GDP)
Q109: Economic growth is determined by<br>A) the rate
Q119: From 2006 to 2010, per capita real
Q128: If you were to ask a Keynesian
Q133: If capital is equal to 150,000 and
Q136: Secondary markets are a valuable institution of
Q144: During the Great Recession, real gross domestic
Q165: In regard to the macroeconomy, it is