The following graph depicts the market for potatoes in West Virginia. Assume there are similar markets for potatoes in all other U.S. states and that the potatoes sold in all states are identical. Further, assume potato sellers incur zero costs to transport potatoes between any U.S. states and that there are no other barriers to trade. Use this graph to answer the following question. 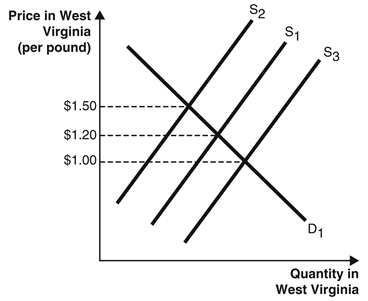
-Suppose the equilibrium price of a pound of potatoes in all U.S.states is initially $1.20.Which scenario could cause a shift in West Virginia from S1 to S2 as shown in the graph?
Definitions:
Q4: A _ error consists of rejecting
Q15: Contractionary monetary policy _ interest rates, causing
Q25: In your text, two important methods were
Q56: According to the figure, if an expansionary
Q59: Which of the following expressions are
Q65: Suppose that a test procedure about
Q83: _ exchange rates are exchange rates that
Q138: An appreciation of the _ is shown
Q164: On August 1, 2016, the price of
Q175: If the Japanese central bank increases the