The figure below shows the production possibilities frontier for Good A and Good B.In the figure below,given the quantity of resources and level of technology,which of the following points is unattainable?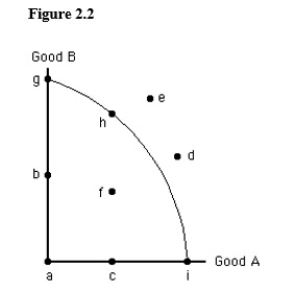
Definitions:
Assembly Lines
Manufacturing processes in which parts are added to a product in a sequential manner using optimally planned workflows to create a finished product much faster than with traditional methods.
Test Statistic
A value calculated from sample data during a hypothesis test used to determine whether to reject the null hypothesis.
Critical Value
A threshold value that defines the boundary of the rejection region in hypothesis testing, beyond which the null hypothesis is rejected.
Thalamus
A brain structure acting as a relay station for sensory information, excluding the sense of smell, to the cerebral cortex.
Q34: If Chase Manhattan Bank quotes bid and
Q36: A public good is one that is
Q54: Which of the following is an accurate
Q56: The production possibilities frontier will shift if
Q78: In economics,money is an example of capital.
Q81: Unilateral transfers refer to two-sided transactions, reflecting
Q86: Comparative advantage is based on opportunity costs.
Q103: Opportunity cost is objective;therefore,its value does not
Q135: Assume that Boeing anticipates receiving 20 million
Q155: To serve the public interest,government sometimes promotes