Multiple Choice
The following figure shows the demand curves for baby formula.Which of the following changes is likely to happen if the price of baby formula decreases?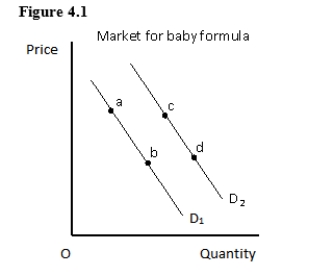
Definitions:
Related Questions
Q1: Which of the following types of unemployment
Q4: The figure below shows the aggregate demand
Q13: Household production increases when there is a
Q22: You want to sell your old iPad
Q24: A price floor set below the equilibrium
Q72: Which of the following would be excluded
Q73: Despite specialization and comparative advantage,household production still
Q74: If Daniel produces one pair of shoes
Q88: If the production possibilities frontier is a
Q147: Which of these is the most ideal