Figure 11.2 shows the relationship between the price level and real GDP.Suppose the economy is currently at e'.A leftward shift of the short-run aggregate supply curve would return the economy to potential output at: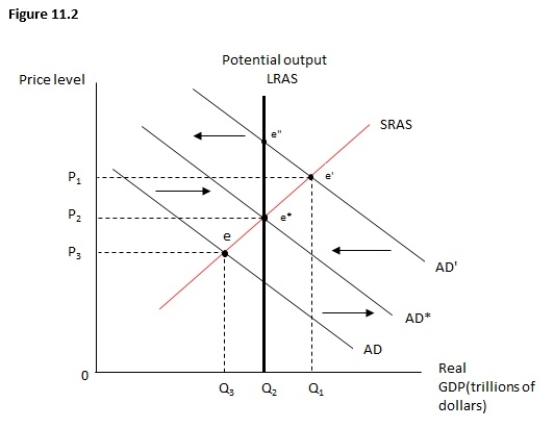
Definitions:
Taxable Income
The portion of an individual's or corporation's income that is subject to taxes by the government.
Tax Schedule
A chart or formula that outlines the rate of taxation applied to various levels of income or profits.
Marginal Tax Rate
The rate at which the last dollar of income is taxed, reflecting the percentage of tax applied to your income for each tax bracket in which you qualify.
Average Tax Rate
The portion of total income that is paid as taxes, calculated by dividing the total amount of taxes paid by the taxpayer's total income.
Q1: If the Naval Research Laboratory fired a
Q8: According to Keynesian theory,the natural forces in
Q14: The reserve requirement refers to:<br>A)the fraction of
Q58: If the U.S.government spent $20 million paying
Q77: Which of the following is most critical
Q117: Suppose the actual and expected price levels
Q128: Despite the large federal deficits during the
Q129: The figure below shows the short-run aggregate
Q129: Compared to many other countries,the United States
Q134: One characteristic of cattle that makes them