The following graph shows U.S.demand for and domestic supply of a good.Suppose the world price of the good is $1.00 per unit and a specific tariff of $0.50 per unit is imposed on each unit of imported good.In such a case,the gain in producer surplus as a result of a tariff of $0.50 per unit is represented by the area _____.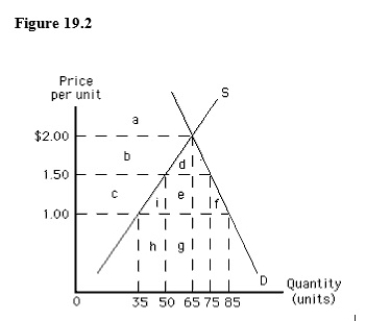
Definitions:
Q9: Banks create money when they make loans.
Q12: The following graph shows the supply of
Q15: In the long run,an expansionary monetary policy
Q17: The Bretton Woods system:<br>A)established a worldwide gold
Q70: The following graph shows U.S.demand for and
Q74: A policy to increase aggregate demand to
Q87: The following image shows the market for
Q116: According to _,developing countries can grow faster
Q145: The Asian Tigers that have graduated from
Q146: According to the active policy approach,the elimination