The following graph shows the demand for and the supply of a good in a country.If the world price of the good is $2.00 per unit,the import quota that would least affect the level of imports in this country is_____.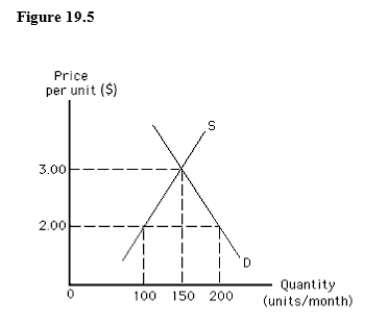
Definitions:
Accounting Profits
The total revenue of a company minus the explicit costs and depreciation expenses.
Total Costs
Total costs represent the complete sum of all expenses incurred by a business in the production of goods or services, including both fixed and variable costs.
Variable Cost
Costs that change in proportion to the level of activity or volume of goods produced.
Fixed Cost
Costs that do not vary with the level of output or sales, such as rent, salaries, or property taxes, consistent regardless of business activity.
Q20: A simple price index is the ratio
Q20: Given the expected price level,policies for reaching
Q37: Child labor limits educational opportunities in developing
Q38: The demand curve for investment depicts:<br>A)an inverse
Q52: An aging population poses fiscal problems for
Q62: In general,it can be asserted that foreign
Q100: Japan has one of the most developed
Q113: If on Monday of a week $1
Q135: To maximize its profit,a bank will:<br>A)minimize the
Q145: If the simple money multiplier is 5,the