A statistics course at a large university is taught in each semester. A student has noticed that the students in semester 1 and semester 2 are enrolled in different degrees. To investigate, the student takes a random sample of 25 students from semester 1 and 25 students from semester 2 and records their final marks (%) provided in the table below. Excel was used to generate descriptive statistics on each sample.
Assume that student final marks are normally distributed in each semester. 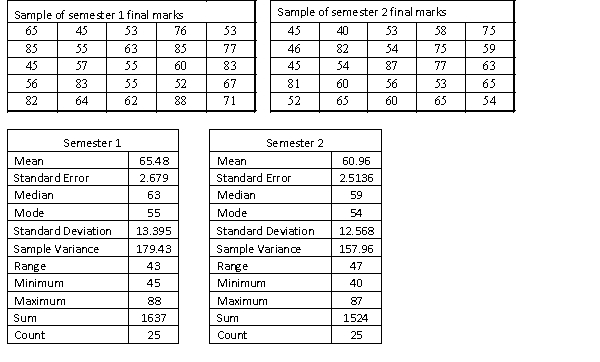 There is a rumor going around the university that students with a higher IQ are enrolled in the semester 1 statistics course because they tend to be students enrolled in the degree with the higher entrance score for university. Can it be concluded at the 5% significance level that semester 1 students have a higher average final mark than semester 2 students? Assume that the population variances are unknown and equal.
Definitions:
Normally Distributed
Describes a statistical distribution that is symmetric about the mean, showing that data near the mean are more frequent in occurrence.
Mean
The average value of a set of numbers, indicating the central point of a data distribution.
Standard Normal
A normal distribution with a mean of zero and a standard deviation of one, used as the basis for z-scores in statistics.
Standard Deviation
A metric that calculates how much a dataset's values spread out or diverge from their average.
Q27: A Wilcoxon rank sum test for comparing
Q27: An economist is in the process
Q30: The irradiation of food to destroy
Q36: The primary factor that contributes to more
Q54: Which of the following statements is correct
Q66: U.S.capital outflows occur when foreigners purchase U.S.assets.
Q77: A traffic consultant has analysed the
Q79: An economist is in the process
Q88: In explaining the amount of money spent
Q90: In multiple regression, the problem of multicollinearity