A statistics course at a large university is taught in each semester. A student has noticed that the students in semester 1 and semester 2 are enrolled in different degrees. To investigate, the student takes a random sample of 25 students from semester 1 and 25 students from semester 2 and records their final marks (%) provided in the table below. Excel was used to generate descriptive statistics on each sample.
Assume that student final marks are normally distributed in each semester. 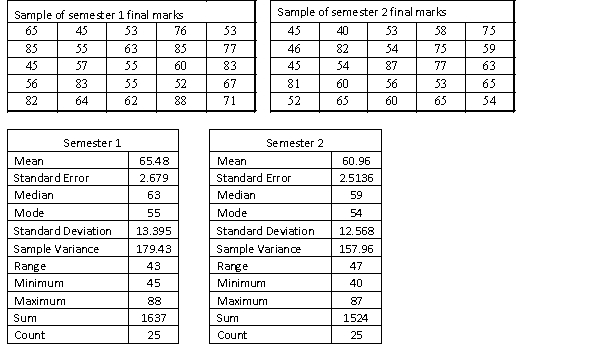 (a) Can we conclude at the 5% level of significance that semester 1 students have a higher proportion of high distinctions than semester 2 students, where a high distinction is a final mark greater than or equal to 85%?
(b) Find the p-value of the test, and explain how to use it to test the hypotheses.
Definitions:
Q12: An economist wanted to develop a
Q16: The term <span class="ql-formula" data-value="b
Q17: The Bretton Woods system:<br>A)established a worldwide gold
Q34: Videocassette recorder (VCR) tapes are designed
Q71: A non-parametric method to compare two populations,
Q82: Which of the following is the alternative
Q83: If the U.S.dollar depreciates,it becomes cheaper for
Q100: Japan has one of the most developed
Q113: In order to test the validity of
Q170: In simple linear regression, the coefficient