Multiple Choice
Figure 5-4 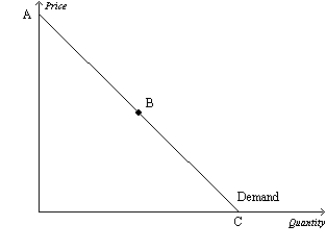
-Refer to Figure 5-4.If the price increases in the region of the demand curve between points B and C,we can expect total revenue to
Definitions:
Related Questions
Q57: Refer to Figure 5-15.Using the midpoint method,what
Q85: Suppose that when the price rises by
Q91: Most markets in the economy are highly
Q206: Income elasticity of demand measures how<br>A) the
Q321: Elasticity measures how responsive quantity is to
Q408: Suppose there is a decrease in the
Q425: If the cross-price elasticity of demand for
Q452: The smaller the price elasticity of demand,the<br>A)
Q510: Which of the following would cause price
Q533: Refer to Figure 6-9.At which price would