Figure 7-8
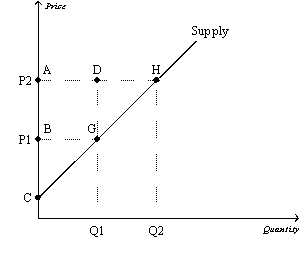
-Refer to Figure 7-8.Which area represents the increase in producer surplus when the price rises from P1 to P2?
Definitions:
Organization Chart
A chart demonstrating the organizational structure, detailing the connections and hierarchical levels of various roles and divisions.
Misinterpreting Data
Incorrectly understanding or concluding from facts or figures, potentially leading to erroneous outcomes or decisions.
Horizontal Rule
A graphical element in the form of a horizontal line used to separate content in digital or printed media.
Sense of Scale
The perception or appreciation of the size or extent of something, often in relation to something else.
Q24: For a good that is taxed,the area
Q37: Refer to Figure 7-23.Which of the following
Q50: Refer to Figure 6-5.Suppose a $3 per-unit
Q63: Refer to Figure 8-2.The per-unit burden of
Q112: Which of the following causes a shortage
Q233: Refer to Figure 7-20.At equilibrium,producer surplus is
Q307: If Darby values a soccer ball at
Q340: Refer to Figure 6-3.Suppose a tax of
Q462: Suppose that the equilibrium price in the
Q490: Refer to Figure 7-21.If the government mandated