Multiple Choice
Figure 10-1 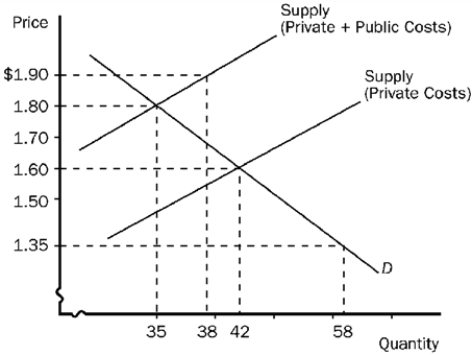
-Refer to Figure 10-1. This graph represents the tobacco industry. The socially optimal price and quantity are
Definitions:
Related Questions
Q36: Why are Pigovian taxes preferred to regulatory
Q71: Suppose that meat producers create a negative
Q119: Dioxin emission that results from the production
Q143: Corrective taxes are typically advocated to correct
Q171: What are the three externalities that are
Q193: Suppose that elementary education creates a positive
Q317: The patent system gives firms greater incentive
Q395: Refer to Scenario 9-1.Suppose the world price
Q396: The goal of industrial policy should be
Q466: Refer to Figure 10-10.A decrease in output