Multiple Choice
Figure 10-9 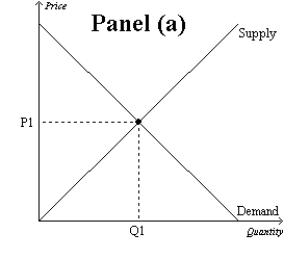
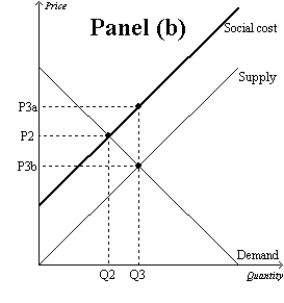
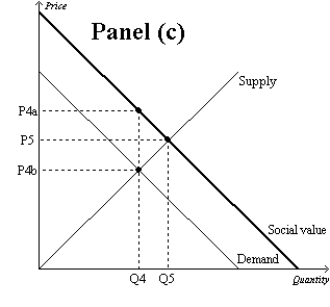
-Refer to Figure 10-9. Which graph represents a market with a negative externality?
Definitions:
Related Questions
Q63: Refer to Figure 10-3.The social cost curve
Q166: Which of the following statements is correct?<br>A)
Q188: When Lisa drives to work every morning,she
Q259: When an industry is characterized by technology
Q264: Refer to Figure 10-10.The socially optimal quantity
Q267: The General Agreement on Tariffs and Trade
Q356: The Environmental Protection Agency (EPA)cannot reach a
Q362: Which of the following statements is not
Q369: Refer to Figure 9-15.For the saddle market,area
Q370: Knowledge is an example of a<br>A) public